My inaugural blog would have been a bit more fun to write if we were coming off the tail of a huge win over a conference playoff contender. Instead, we’re following up on a 7-2 blowout loss from the buzzing Tampa Bay Lightning. C’est la vie.
That was what I originally wrote twelve days ago, being slightly bummed out that I couldn’t kick things off on a positive note. While I try to remain realistic and fair, I lean towards trying to remain positive, even in the face of obvious issues. Well, can’t get worse than that, I said to myself after that drubbing. It turns out—it very much can.
The Flyers are currently in no man’s land—not quite a guaranteed playoff team, but not one of the five worst teams in the league. Most of the analytics models have the Flyers somewhere between 86 and 90 points, and at one point, they projected about ten points higher than that. Now, no one is certain where this team will land.
This dovetails into a major conversation piece that many in the social media land and greater hockey community at large have been discussing with increasing uncertainty and confusion: What is this team? At one point, the question was “Are they actually good?” As of writing, the Flyers are currently on pace for 92 points, behind the Toronto Maple Leafs in the Wild Card hunt. Even when the Flyers were performing well, there was a cloud of anxiety about the team’s success, as if the hockey gods were menacingly holding onto the rug underneath fans’ feet, undecided if they wanted to yank it and send them tumbling to the ground. It’s hard to tell if we’ve been launched off our feet.
After all, it feels like the Flyers just started their rebuild. It could be argued that the Flyers’ rebuild unofficially kicked off in 2022 with the top-five selection of Cutter Gauthier. Matvei Michkov, the 2023 seventh overall pick, is in his sophomore season. Jett Luchanko and Porter Martone, the 2024 and 2025 first-round picks, are not actively with the team. While the team’s success is largely being driven by the team’s younger players like Trevor Zegras, Cam York, Jamie Drysdale, and, until his injury, Tyson Foerster, there are a whole lot of prospects in the pool that haven’t played a full season of NHL hockey that the Flyers are hoping solve their long-standing issue of a lack of high-end talent.
So why the nervousness? Most likely, it stems from the fact that we’ve been in this exact position recently. Two years ago, the Flyers were holding onto a playoff position until January, when Carter Hart was indicted on criminal charges and stepped away from the team. They ended up missing the playoffs by a single game. The following year, they face planted to fourth worst in the league. It is fairly understandable to come away with the conclusion that this is a rebuilding team that’s just not very good.
But what if they have made tangible improvements that have the makeup of an actually good team underneath a bad stretch of hockey? They have made several offseason moves, such as bringing in the aforementioned Zegras, as well as Christian Dvorak (their current top line center), Dan Vladar (their current starting goaltender), and a coaching change, with John Tortorella out and Rick Tocchet in. Why couldn’t that be enough? Or is there a looming issue that will cause this team to come crashing back to reality?
We’re going to take a look at just what happened the last two years, the shortfalls of those teams that led them to end with unsatisfactory results, and the current underlying metrics that may help give us an idea of what this team really is, with over half the season completed.
Baseline Comparison
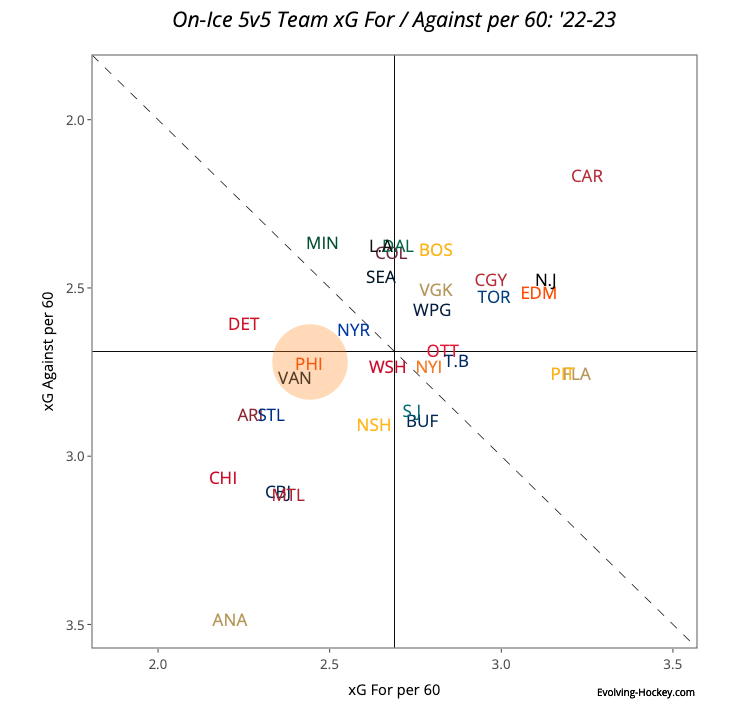
Let’s begin with just a reminder of what the last two seasons looked like from a standings perspective.
Compared to the last two years, this Flyers team is on a decent path. The one warning sign is almost having the same amount of OT losses (and a staggering number of OT games as well). It seems as of late that might have foretold a potential losing streak. Good teams win in regulation, and overtime wins can give you a false positive, as there is inherently a lot of randomness and, more importantly, luck involved. But this is still a decent record for a team whose designated goal was to play meaningful games later in the year.
But let’s take a look at the fancy stats to get a better idea of what’s going on from an on-ice production standpoint.
As a reminder, the statistics in the above chart are as follows:
Goals For Percentage (GF%) = How many actual goals you scored vs. those scored against you.

Corsi For Percentage (CF%) = Shots on goal, blocked shots, and missed shots vs. those shots against you.

Expected Goals For Percentage (CF%) = How many expected goals you scored vs. those you scored against, using Evolving Hockey's model.
The Flyers under John Tortorella had a fairly distinct identity: they were fairly good at producing and limiting expected goals, were a bit mediocre at limiting and generating shots, but couldn’t outscore opponents. At one point under Rick Tocchet, the Flyers were performing quite poorly in both Corsi and expected goals, but made up for it with their actual goals for rate. Well, it seems like that’s not the case anymore, as after a brutal stretch, they’ve seen their finishing rates plummet. This is something that underlying metrics can often predict, as the two usually aren’t too far apart. So when one drifts high, you can expect the other to either follow or pull the drifter back down.
Compare the following charts (the good teams are in the top right):
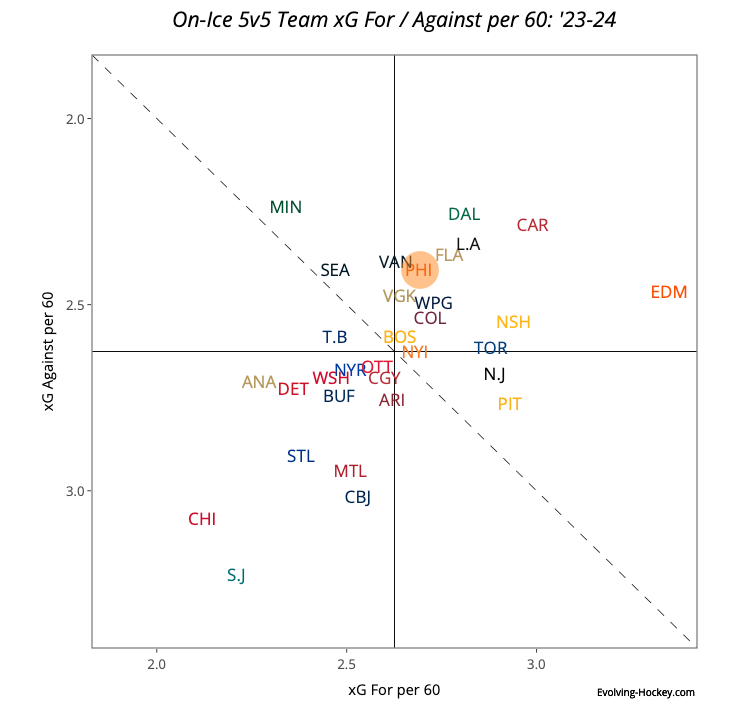
The Flyers were surrounded by quite a lot of good teams in 23-24. How about 24-25?
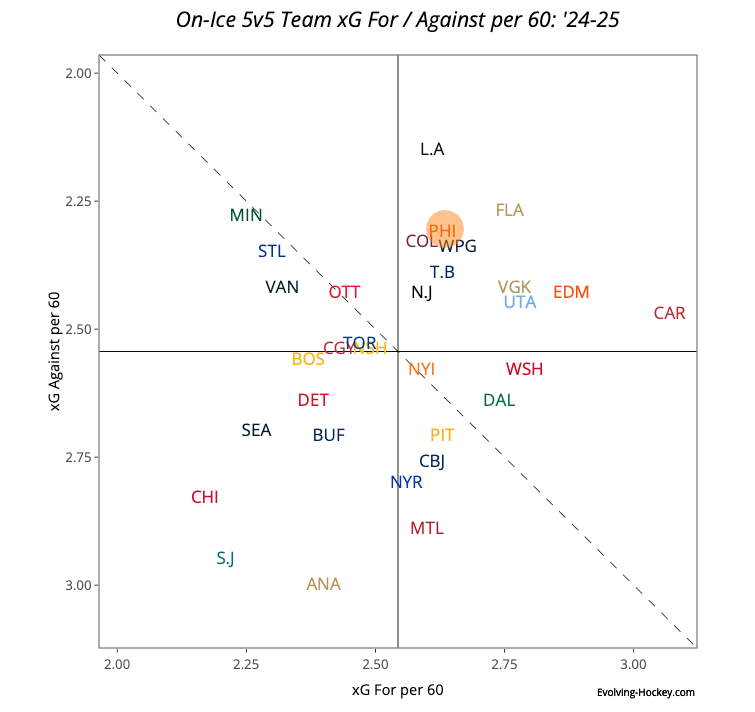
…slightly better in 24-25! They were consistently above average in both offensive and defensive categories, which is very unusual for a team that was a lottery pick. Then we arrive at today…
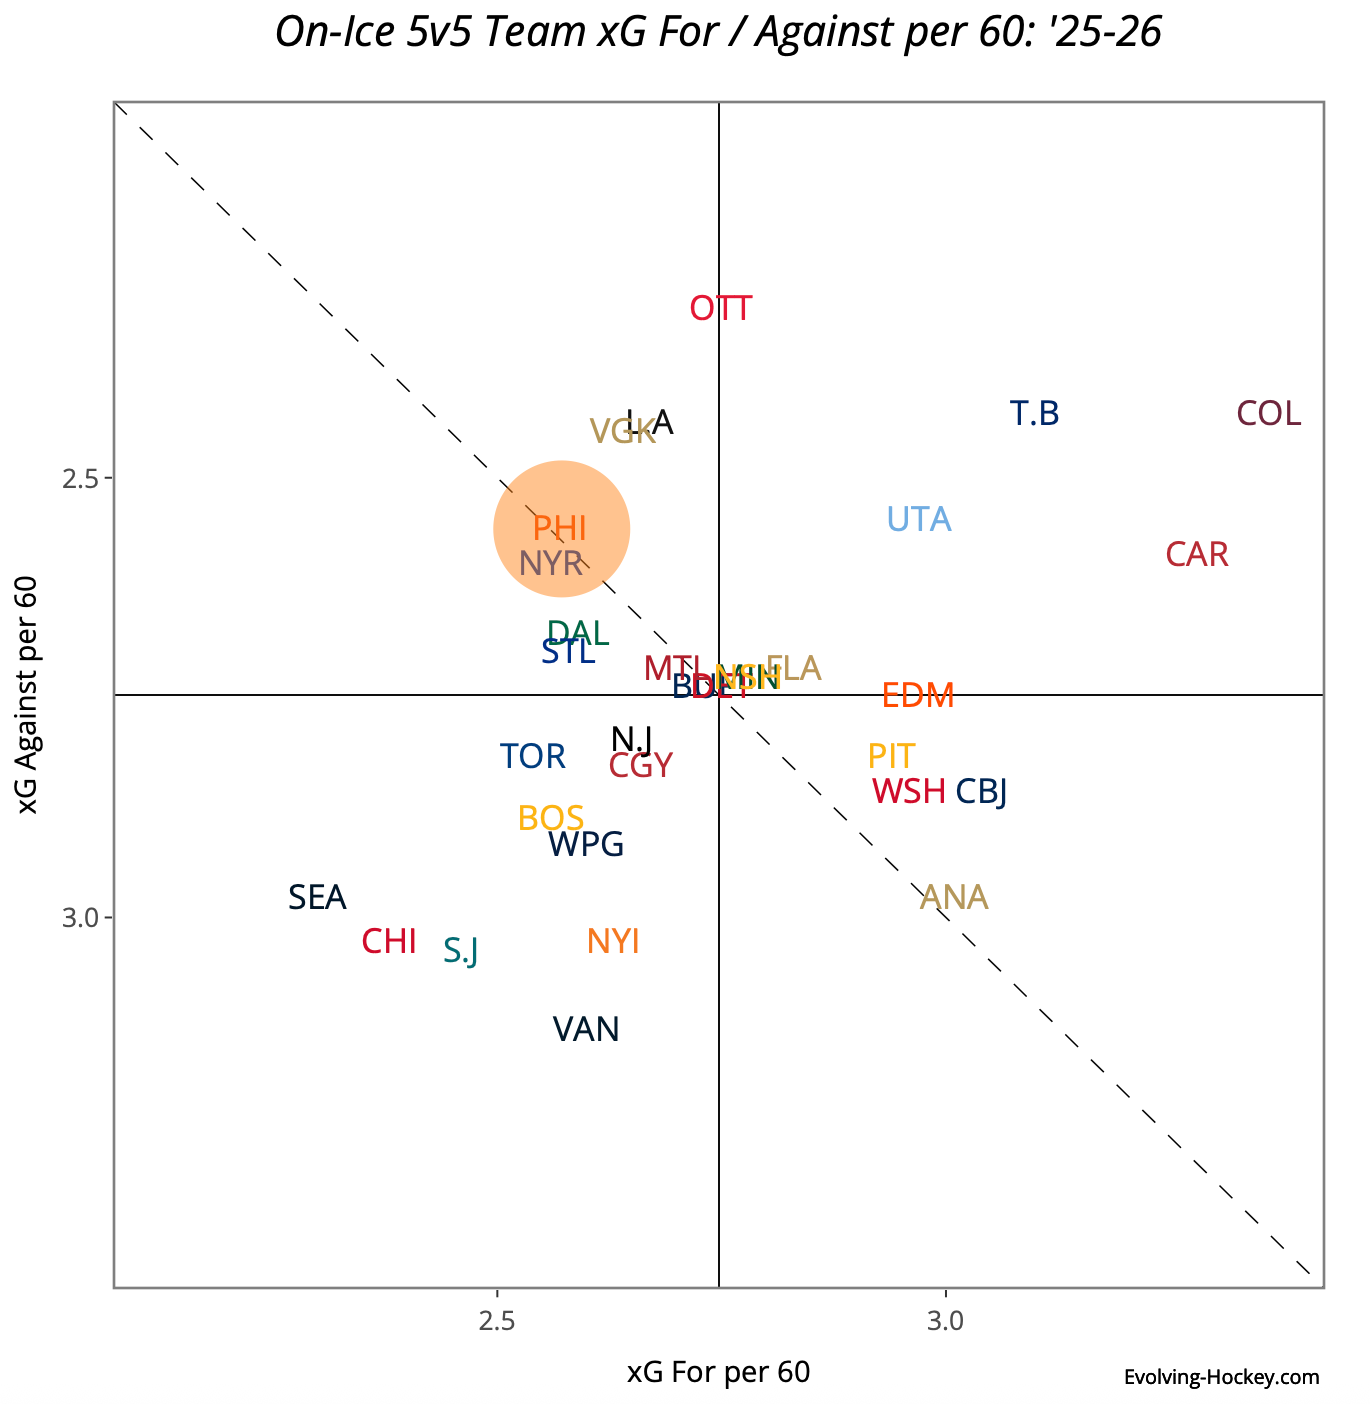
…and it is not as sexy. To the Flyers’ credit, this is a brand new offensive scheme with a new coach. Tortorella’s first year did not produce anything spectacular and was actually below average as a unit in both categories.
Tocchet’s club has been fairly hot and cold. They seemingly do well for a stretch, but then the wheels sort of fall off.
This makes sense. They’re a young (5th youngest in the league) rebuilding team with a brand new coach. I’m aware that if you’ve been following the Flyers for the last two years, we all know where this is going as to the major reasons why the Flyers look better in the standings this year, and the previous two teams did not perform as well (it rhymes with coaltending). So we might just want to rip that band-aid off and ask the question.
What Happened in 23-24 and 24-25?
23-24
Going in chronological order, we start with a season divided by two halves.
In January of 2024, Carter Hart took a leave of absence from the team, which preceded being charged by the police, and he would play his last game with the Flyers. Hart was a solid but not all-star caliber goaltender (he had his fair share of stinkers), and having him finish out the season is not a guarantee that results would have been better. Given the circumstances around his departure, that’s about as much as I’ll say about his impact on the club, and his name will only be used as a designation point.
The first 60 games or so were actually very good for the 23-24 Flyers, hence their competitiveness in the playoff race. They played very well and seemingly did not give up that edge, even with the loss of Sean Walker at the deadline, and the morale hit it made on the team. The skaters remained competitive throughout the season, or at the very least did their part in staying consistent.
An interesting point here is that at the end of the chart, you can see an explosion in expected goals for. Were they sacrificing their defensive responsibilities to churn out more offense? It certainly didn’t help them produce more goals.
From the looks at how the team ended the year, no, they did not abandon responsibilities. They remained largely in line with their season to date, but only actual goals for skyrocketed once the goaltending situation became untenable. The Flyers in 2023-24 were a stingy team, capable of keeping high danger chances down and winning through attrition and counterattacks. So what would happen with a full year of that?
24-25
There aren’t too many times that I feel like a singular chart can describe a season. This is one of the exceptions.
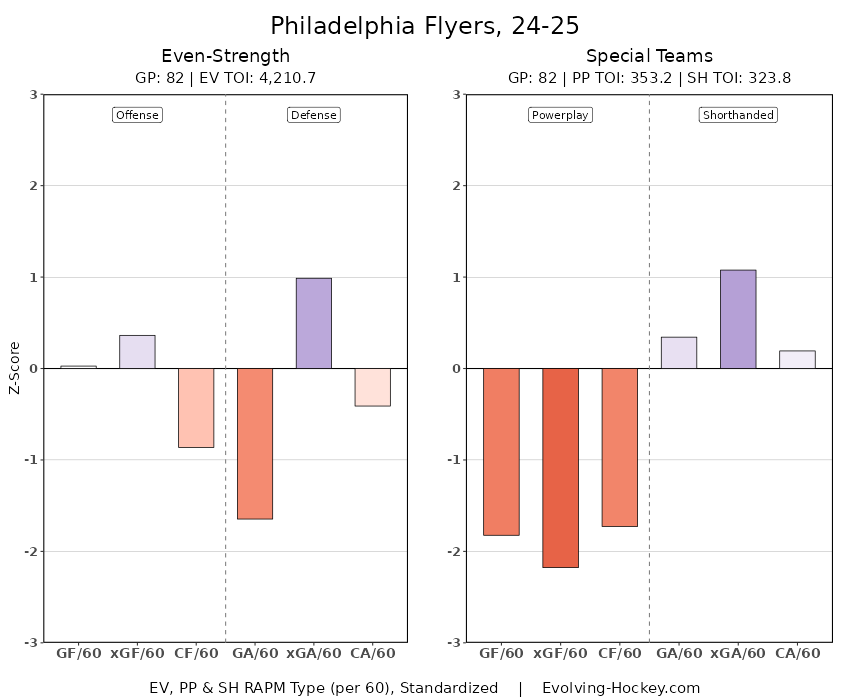
The Flyers in 24-25 were a good play-driving team (87th percentile by expected goal differential) that was completely bogged down by abhorrent goaltending (GA/60 demonstrates this fairly well on the chart above) and power play. They weren’t an incredible team under the hood by any means (their offense left a lot to be desired), but there is a competent group of skaters, so long as they don’t have an extra man on the ice, which caused them to forget where to put the puck.
You should be feeling a bit of deja vu reading that paragraph, as it’s basically just a continuation of 23-24, but with a full year of results. The Flyers were basically the same team as they were to end the year, and it is not surprising then that the Flyers finished fourth-worst in the league.
So it is just goaltending (always_has_been.jpg)? Are the Flyers’ hopes and dreams of winning their first round since 2020 reliant on Dan Vladar? Or is there more underneath the surface that explains what could possibly make this year a different outcome?
What’s Different in 25-26
As a baseline, here is the same RAPM chart we used in 24-25, but for the season to date.
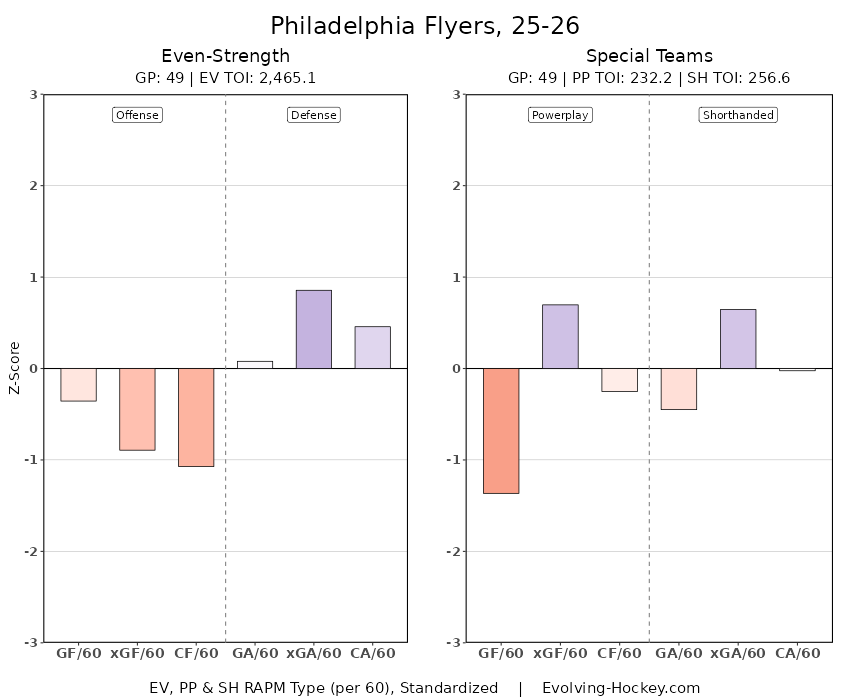
Noticeably, the xGF has taken a nose dive, while defensively they’re on the whole better (GA/60 is the biggest increase, we’re getting to that, I promise). The power play is still not closing on their chances, but they’re at the very least driving play in the zone now. Overall, a fairly similar situation.
So what’s driving all of these changes? Taking into account player development and additions and subtractions to the roster, let’s look at how the Flyers stack up by comparing the two seasons before this one to now. To do so, we’ll use Evolving Hockey’s expected Standing Points Above Replacement (or xSPAR).
How SPAR works is pretty simple: it’s a value of a player based on their predicted strength on the ice, translated into how many standing points that play brings. A negative value player can lose you games, which means removing them from the roster and replacing them with a theoretical baseline NHL player adds wins to your team.
A few notes on the data below: first, 23-25 is an average between the two years. Second, this is a minimum of 200 minutes played, hence why a player who hasn’t played a lot this season, like Nic Deslauriers, doesn’t have any 25-26 value.
First, the skaters.
Newcomers
The Flyers had a big value add in 25-26. Trevor Zegras is everything the Flyers hoped for, basically generating the value of two wins and an overtime loss on his own. He’s been a huge boost to the top half of the lineup. Carl Grundstrom and Nikita Grebenkin have added a fair bit of value as well, supplying the bottom six with stable play. And finally, Denver Barkey has been more than advertised. He’s been a play-driving monster in the fifteen games with the club so far.
But not everyone who’s been a mainstay this year has been positive. Christian Dvorak (with a fresh, new five-year contract) and Noah Juulsen haven’t graded out very well by this particular model. If I’m putting on my detective hat, I do think xSPAR is underrating Dvorak a bit, while I don’t personally think he’s been above “just fine.”
Who Improved
Tyson Foerster was off to an incredible start before he was injured in early December, and was looking like Mark Stone-lite. Why the negative value, then? With his injury this year, he is likely not to provide as much value as he did the previous year. While that shouldn’t be held against Foerster as a player, it does make the team worse overall.
Several others are seeing noticeable improvements, notably Cam York, Bobby Brink, and Emil Andrae. Outside of Foerster, I would not call any of the improvements an “ascension” by any means. But twelve of the twenty-one players saw improvements, which is great to see for a young team.
Who Declined
The two biggest names toward the bottom of the list are clearly Travis Konecny and Rasmus Ristolainen. Konecny has been maligned by almost every public model this year (sans Dom Luczyszyn’s Net Rating, which is closer to how the public eye would see a player). Why Konecny grades out so poorly by most models is the subject of another article. The TLDR is that Konecny requires other play drivers to do his thing, as well as being not so hot in his own zone, and that drags his value down significantly.
Ristolainen, coming off a season-ending injury in 24-25, looked physically impressive, but his underlying numbers struggled upon return. The hope was that he would play himself into shape, but unfortunately was sidelined with another injury.
Unfortunately, two very important pieces to the rebuild also live in the negatives. Matvei Michkov and Jamie Drysdale both are providing about a point loss in the standings this year compared to what they delivered last year. It’s quite a shame for Drysdale in particular, as he started off the season so strongly only to dwindle back down.
Roster Moves
A big addition by subtraction was a wonderful human being, but increasingly unhelpful forward Scott Laughton. Trading him for a first and Nikita Grebenkin 3.89 xSPAR alone, a tidy bit of business by Flyers General Manager Daniel Briere. The same could be said of Deslauriers, who just by sitting has helped the Flyers tremendously.
Outside of Laughton, the majority of the Flyers’ roster moves did make the team ever so weaker. All of Joel Farabee, Ryan Poehling, Morgan Frost, Sean Walker, and yes, even the much-maligned Egor Zamula, were net positive players in their time here. Now, you could argue that it was good to move off of all of them for one reason or another. For most, it was time to move on as we had hit their projected ceiling here and with little to improve. For others, perhaps their perception within the team did not align with the public models. Either way, they are no longer here, and we will be subtracting their value.
All in all, tallying up the differences brings us to +0.9 xSPAR, which is basically an overtime loss of a difference. The skaters are largely the same. However, we still need to analyze one major piece: the goaltenders.
Goaltending
This time, there’s a noticeable difference in how much blue is on the chart. After losing Ivan Fedotov, Cal Petersen, and Felix Sandstrom, the Flyers added quite a lot of standing points in 2025-26. But the biggest addition by far has been the inclusion of Dan Vladar, adding nearly four wins to the roster on his own this year. The goaltending change added a massive 9.4 SPAR, even with Ersson continuing his downward spiral.
This makes complete sense to me. The moment Vladar found himself out of the lineup, the Flyers looked closer to a team with a top-five pick than a team gearing up for a playoff berth.
Conclusion
So once again, we come to the conclusion that I have to assume if you’ve been following the team this decade: the Flyers are living and dying by their ability to stop the puck from going in the net. Still. Forever. Maybe. Probably.
So that’s it, huh? Is this a two-thousand-plus-word piece, the opening piece to this new blog, just to post this silly meme?

You’re god damn right.