“...you're looking to the guy who everybody in the room, and I'm saying this about Travis Konecny, everybody in the room says Travis Konecny is the best player on the team...”
- Charlie O'Connor, PHLY Flyers Podcast, Jan 15, 2026
This quote has been bouncing around in my head since I heard it. There was also a longer quote in which the players on the Philadelphia Flyers, completely unprompted, mentioned that Flyers winger Travis Konecny is the best player on the team. Universally. Without hesitation. As sure as the Earth orbits the Sun.
And you know what, on the surface, why wouldn't they be correct? Konecny is the leading scorer on the Flyers for the last five years with 311 points (124 points higher than second place). He has been selected for the Four Nations Canadian roster. He was also allegedly pretty close to being an Olympian this year and representing the Flyers on a stacked Canadian roster. Those are some strong accolades, and if you primarily follow hockey outside of the online world, you would likely need a strong argument to think that they're possibly not true.
But if Konecny has received any consistent criticism for his on-ice results, it's been from some of the public analytics models. You know the ones—those complicated charts filled with numbers and colors made by those filthy nerds with their math degrees who need to be reminded to watch a game instead of typing lines of code into their Jupyter Notebook. Those models typically tell a different story; one in which Travis Konecny is a largely fine player but around league average (or sometimes worse) in terms of what he brings to a team.
Given my other articles heavily featuring public models, posts about xG on BlueSky, and general nerd interests, you might think that this is about to become a full-throated endorsement that nerds do, in fact, rule and jocks, by proxy, drool. Not so fast; you should know not to judge a blog by its title screen mission statement.
While this article might not reach a "Hater's Guide to Analytics", it will hopefully serve as a deep dive into some of the blind spots of public models as well as a defense of the value of their findings. We'll attempt to piece together what the missing link between what they value and a player like Konecny brings to a team that may be caused by a mismatch of expectations and biases.
Why do analytics even exist?
First, a rant.
Hockey is a sport about counting. The team that scores the most goals within a defined time limit wins the game. For the players and teams interested in winning, the question invariably becomes what the best/most efficient way to score goals and prevent our opponents from doing the same. Eventually, you need to figure out which players you have are the best at doing just that.
If you go by the eye test, it is very easy to spot someone who has good offensive traits, such as stick handling, shots, and goals. There's usually a big ass horn that blasts the arena when a goal is scored, just in case you missed it. Very helpful. But again, keeping track of what this all means in aggregate can be tricky without some tabulation and record-keeping. To make matters worse, defensive impact is very hard to notice, connect to other plays, and even remember how often a player prevents chances against their team with good positioning, stick work, or board/net-front work without letting selection and memory bias. The pros and scouts may be able to do it, but fans certainly struggle.
If you talk to anyone about the sport and discuss the topic "who is good at hockey?", you will eventually have to cite some sort of number. Points, goals, assists, penalty minutes, whatever your flavor, it is a number at the end of the day.
This is where an important question comes in: how do you know for sure that a number has any meaning? Are goals a strong indicator of a good player? Are points? How do you even measure defensive impact? If you believe goals are unequivocally useful to the end of describing how good a player is, imagine this scenario:
Player A breaks into the offensive zone with the puck, dipsy doodles around two defending players, and slides it to a wide-open Player B, who taps the puck in for an easy goal.
If you were watching the game, you would think that Player A did most of the legwork and probably deserves more of the credit, but on the stat sheet, you would see Player B with the goal and Player A with just a lowly assist.
In this scenario, I'm basically describing most of Connor McDavid's career.
The way it works with Connor McDavid (it's his birthday) is that he passes you the puck and then you put it in the net. There are other things also but that is the main thing.
— Micah McCurdy (@hockeyviz.com) January 13, 2025 at 1:17 PM
[image or embed]
Very few people would argue that McDavid is anything less than one of the finest hockey players in the sport today. Because virtually no one can watch every game from every player and remember what they saw specifically, you're going to need to eventually consult a stat sheet, which then creates a real problem.
Compounding this issue is the other end of the ice: defensive impact. There is only one true box score stat that accounts for player defensive impact, and that's plus-minus. It's a stat riddled with issues (it punishes good players on bad teams, and it's largely driven by goaltending are two of the bigger ones).
The questioning of whether or not the box scores really defined good and bad players (along with personal biases of coaches and scouts) is what caused the rise of analytics in sports in the first place. Out of this primordial ooze of questioning birthed stats like Corsi, Fenwick, Expected Goals, Regularized Adjusted Plus Minus (RAPM), and more ambitious stats like Wins Above Replacement (WAR), Game Score Value Added (GSVA), and Synthetic Goals (sG) were born. These are all trying to answer that same, ever-important question: who is actually good at hockey?
This brings us back to Travis Konecny. By all accounts from the box scores, Konecny has had a decent career. But some of the models have noticed some holes in his game that I think bear a deeper look.
What do Traditional Stats Say About Konecny?
Let's establish a baseline by first taking a look at what makes Konecny stand out if you aren't subscribed to all of the fancy stats.
Konecny by the Box Score
Travis Konency's 25-26 Season Scoring totals, per Natural Stat Trick. Percentile ranks min 400 minutes played.
Purely by the box score, Travis Konecny is an elite producer this year, grading nearly 90 percent better than the league in goals, assists, and points. The guy is good at putting pucks in nets.
He's also been fairly consistent as a scorer in the last few years. Since 2019-2020, Konecny has only been under 50 points one time, a shortened season due to the Covid-19 outbreak, where he was on pace for 57 points in a full season. He has scored more than 30 goals twice and is on pace to do it again this year.
Konecny by the Eye Test
Konecny displays a skill level that sets him apart from his peers. Watch this unbelievable pass to Nathan MacKinnon at the 24-25 IIHF World Championship.
Travis Konecny's great pass to Nathan MacKinnon at the 24-25 IIHF World Championship.
Konecny receives a puck on one knee, while sliding forward, steadies it, and passes it back to MacKinnon without looking. That is a tough sequence to pull off at that speed. This shows off what makes him special as an offensive creator: creativity, vision, and skill.
Konecny is also versatile. His passing game is undoubtedly elite (more on this later), but his shooting ability is no slouch. By NHL Edge, Konecny has an 84th percentile shot speed. His first goal of three against the Columbus Blue Jackets on January 28th does a great job at showing this off.
Travis Konecny's goal against the Columbus Blue Jackets, January 28th, 2026.
It's such a simple shot, but it's deadly: fast release, no real tell of the shot timing, and with some serious velocity. He puts the puck right over the blocker and puts the Flyers within one.
In his own end, Konecny is also tasked by the Flyers to be a penalty killer, with the fourth most time on ice shorthanded this year, behind defensive stalwarts Sean Couturier and Noah Cates (also Christian Dvorak, but we're not going to get into that). While no one thinks of him as a potential Selke winner, as he's known for having his own defensive lapses, he's clearly trusted enough when the team needs him to step up.
So you would think that the models would view him favorably. But now we find out, do they?
How does Travis Konecny grade by analytics models?
Let's take a look at how Konecny grades out from purely an underlying analytics standpoint using five popular models: Evolving Hockey's RAPM and GAR, Dom Luszczyszyn's GSVA, Top Down Hockey, and HockeyViz.
While I will try to do my best to explain each model's use cases and quirks, I will ultimately be insufficient in doing so fully, as I would like this article to be fewer than ten thousand words. I would encourage you to read about more model in depth by visiting their websites.
Evolving Hockey
We're going to look at two different models from Evolving Hockey. The first is Regularized Adjusted Plus Minus (or RAPM).
RAPM
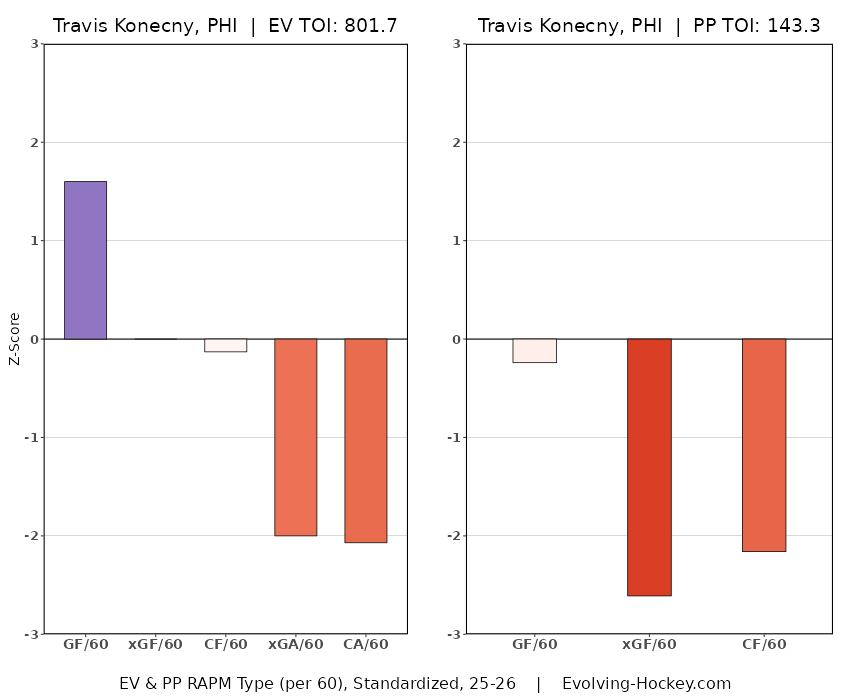
RAPM is unique from the other models we're going to look at in that it doesn't try to sum up a player into one tidy number. Instead, it gives you a better look at commonly used analytics, but in a way that tries to isolate player performance as much as possible. The chart has positive and negative values as they relate to the rest of the league. So if you're right in the middle, you're about a middle-of-the-road player.
This model is going to give us a clue as to a major issue with how models see Konecny. By Goals For per 60 (GF/60), Konecny is very good. That's a finishing stat, meaning you score more than you're "expected" to based on the shot location, angle, and type of shot. Judging from his physical skills and points, this makes sense.
But what Konecny doesn't quite do is drive play, meaning producing a net positive of expected goals (both xGF and xGA above) for his team. His chance quality is about league average, and Konecny doesn't produce a lot of quality chances; he just buries the ones he does produce. This portends an issue: at any point, if he's in a slump, his point production will invariably plummet rather than depress.
A secondary issue is that his expected goals against totals are very bad. He gives up a ton of chances, and quality ones at that. Remember: scoring is great if it's more than your opponents. What RAPM suggests is that when Konecny is on the ice, the Flyers are going to most likely get out-chanced and statistically, lose more often than not.
That's especially bad considering that these are regular-season stats, so this includes teams at the bottom of the standings. Against high-quality opponents, Konecny's weaknesses might start to look like a liability.
Goals Above Replacement (GAR)
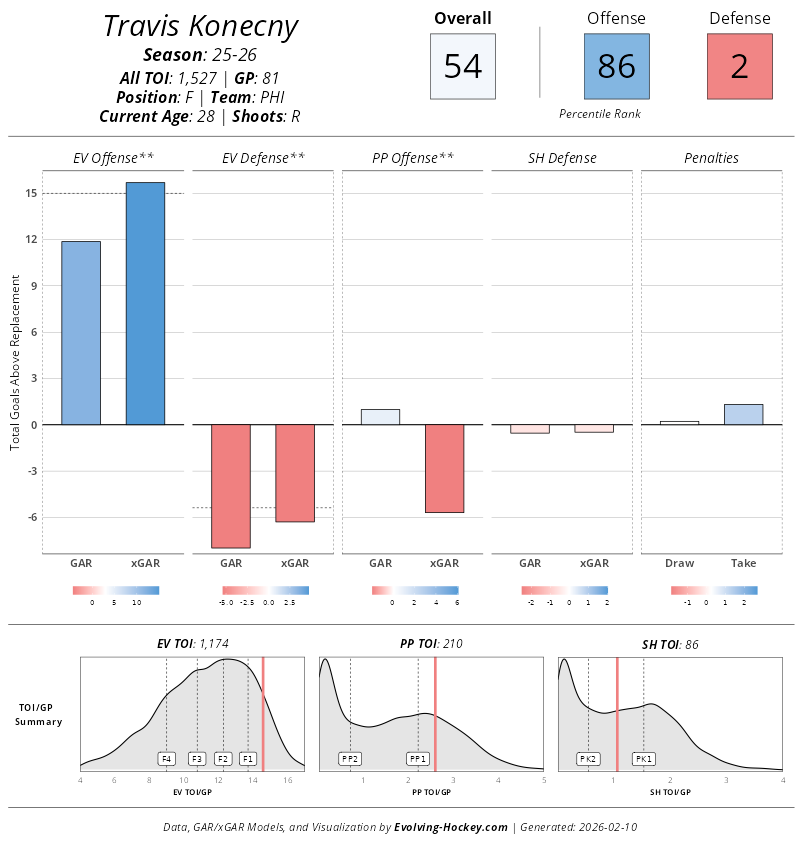
The next model is Evolving Hockey's GAR, which is their attempt at an all-in-one stat that can compare players across teams and years. It is another stat that focuses on isolating impact as much as it can, but it also includes some box score elements. GAR comes in two flavors: GAR and xGAR. As Evolving Hockey describes them, GAR is what did happen while xGA is what should have happened. Luck and streaks are important to account for, both positively and negatively.
By GAR, Konecny is middle of the pack at a 54th percentile mark. He grades out especially well offensively at the 84th percentile, but there's that pesky defense again, at a rock bottom two percent. However, his GAR and xGAR are slightly off, suggesting that both offensively and defensively, Konecny is better than his actual results would suggest.
Let's take a deeper look at a specific game that showcases how these values are calculated. Against the Los Angeles Kings on January 31st, Konecny had a goal and an assist, which is a strong outing. But by expected goals, Konecny was out-chanced while he was on the ice. Let's look at a shot map.
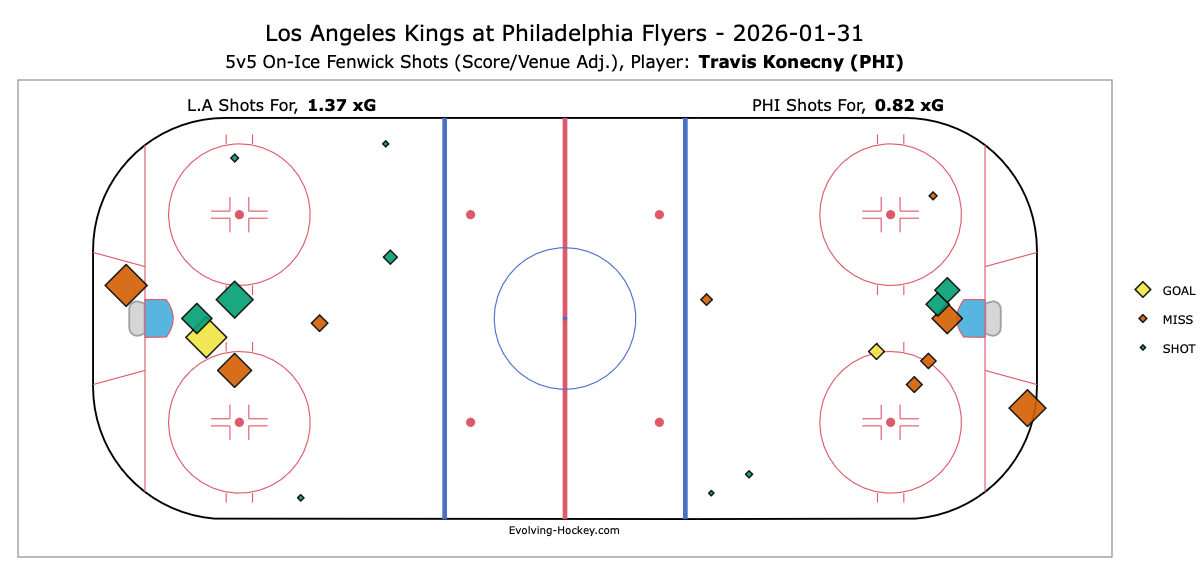
Konecny put up 0.82 expected goals for his team while giving up 1.37, enough for a 40.72 percent expected goal percentage. That's not great. Over a large sample size, you are generally going to lose more games than you win with those stats. But looking at the actual map, there are a few curious points.
The first obvious one is the big miss from behind the net, shot by Corey Perry in the first period. How was a puck at that angle worth so much in expected goals? Let's review the tape.
The video should start at the face-off, 16:59 left in the first period. The Flyers lose the draw, goes back to the point where Drew Doughty shoots the puck. Dan Vladar tries to control the puck but cannot, and an opportunistic Corey Perry grabs it while drifting behind the net and sets up an opportunity out front.
I assume Perry was trying to bounce it off of Vladar, but misses the net and instead tags Alex Laferriere, who nets another try (the orange shot near the left dot), but York gets his stick and prevents a full shot. The puck instead drifts forward for a third and final shot by Adrian Kempe that finally goes in (yellow shot).
That entire sequence was worth roughly 0.84 expected goals (60 percent of what Konecny was on the ice for that game), and it happened within ten seconds. That's also more expected goals than Konecny's line mates produced in the entire 24 minutes of his game.
Was that Konecny's fault alone? Probably not, as it looks more like Jamie Drysdale blows his coverage and allows Perry to sneak in, all of Konecny, Dvorak, and Trevor Zegras hover close to Vladar, allowing Los Angeles's forward to cover more advantageous spots, Cam York tries to prevent Laferriere's shot but cannot, and Zegras was on one knee before Kempe puts it home. You might argue that Konecny blew the zone too fast at the end after Laferriere shot the puck, but it's tough. The entire Flyers squad let Vladar down.
A single game and moment can and does get blown out of proportion and make a game look more lopsided than it was. After all, Konecny is on the ice for two more quality chances against. However, if sequences like the above frequently happen when Konecny is on the ice, that becomes a pattern that tells a story of a player who allows the other team to produce said chances. In this case, the Kings did score off of one of those chances, and statistically, that is likely to happen more often than not if you give up above an expected goal per game.
Dom Luszczyszyn's Game Score Value Added
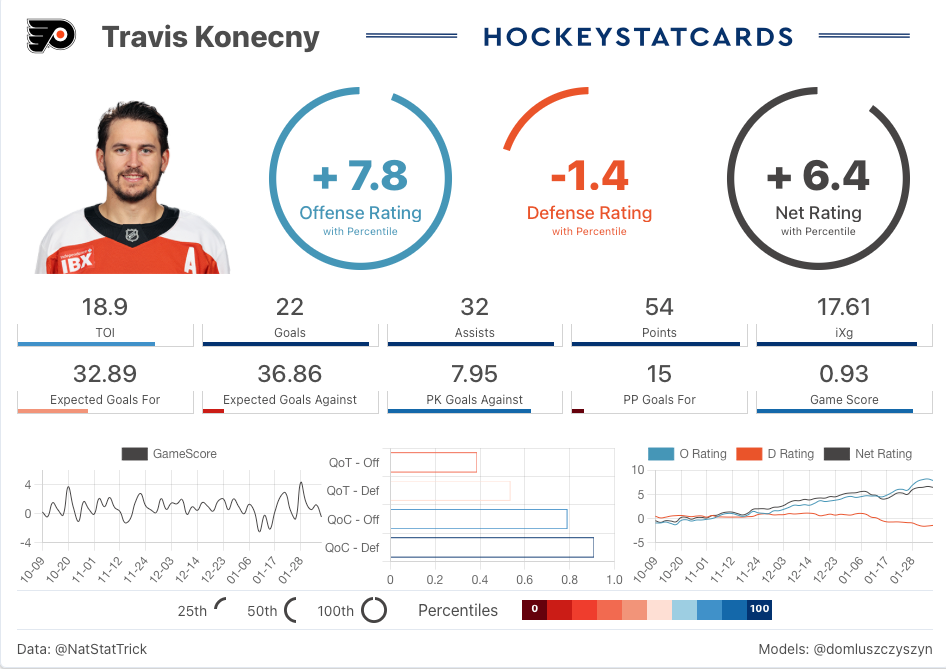
Crazy naming convention aside, GSVA is the model that most aligns with how the traditional hockey world might grade a player. It puts a significant amount of stock into your typical box score metrics like goals and points, which you can see above. Konecny grades out well overall with this model. He's got great production, so-so offensive play driving, and a really poor expected goals against (but surprisingly, grades out well on the penalty kill).
If you find that you tend to agree with this description over the GAR or RAPM models, that's completely fair. Net Rating and Evolving Hockey's GAR model agree on the majority of players.
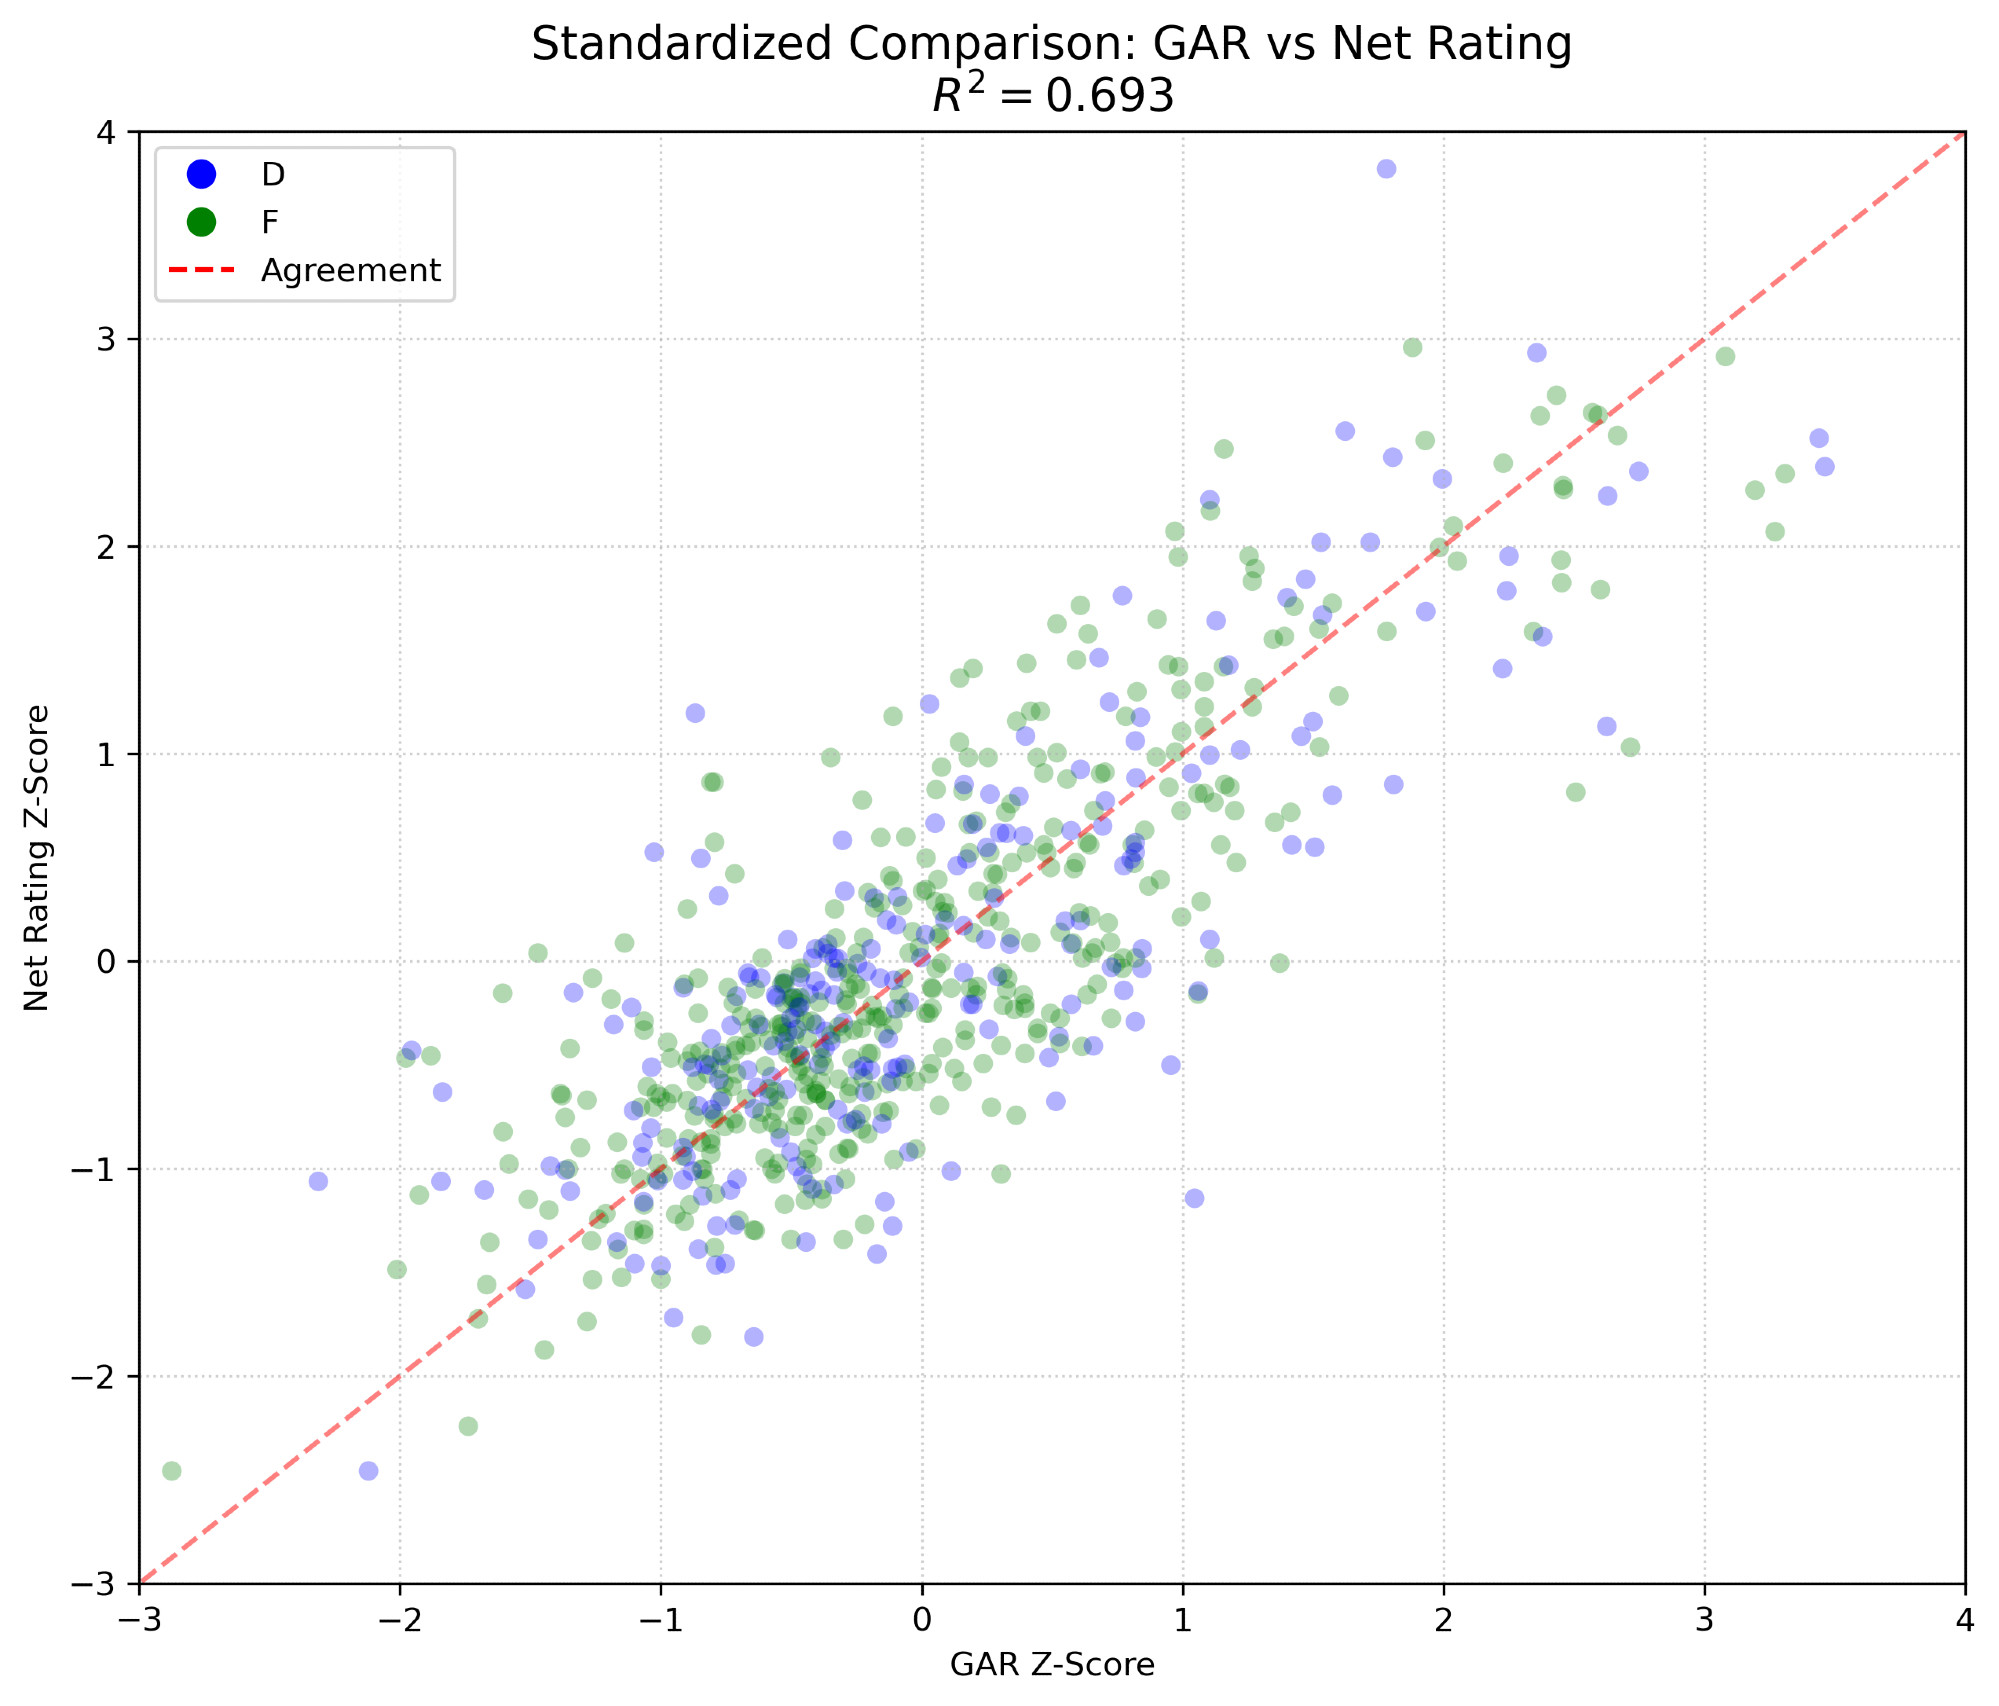
Here's who each model favored and by how much.
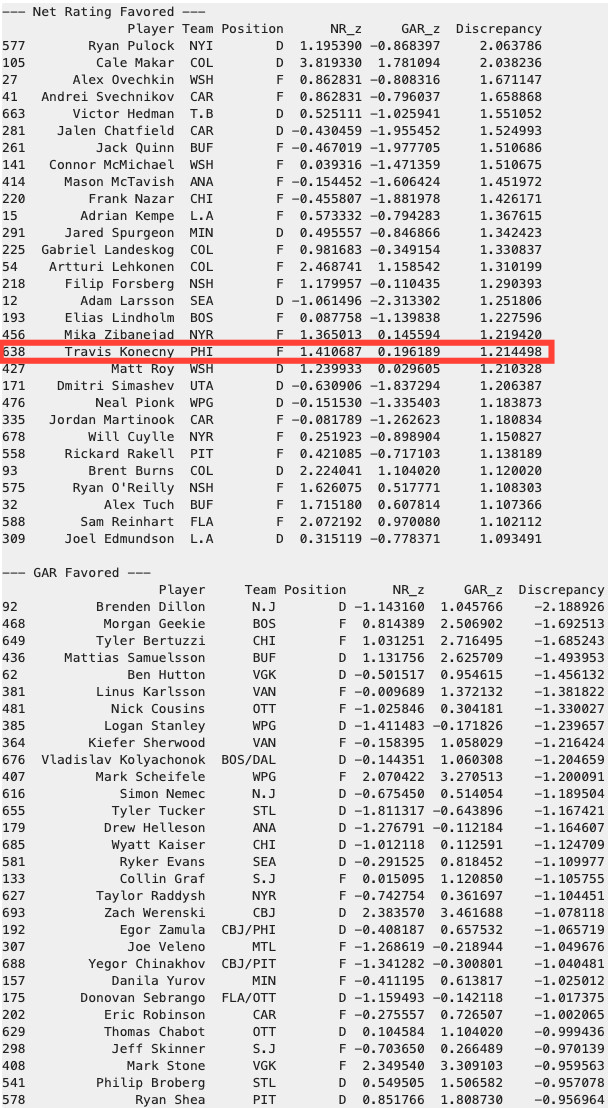
There are some really good players on both lists. GAR thinks that Cale Makar is one of the best defensemen, but Net Rating thinks he's otherworldly. Meanwhile, someone like Wyatt Kaiser doesn't do as well via Net Rating and is seen as a below-average player, but GAR thinks he's about average.
But who do we spot up top in that big orange box? Travis Konecny. He has one of the highest discrepancies between the models, leaning much more favorably by Net Rating than by GAR.
Top Down Hockey
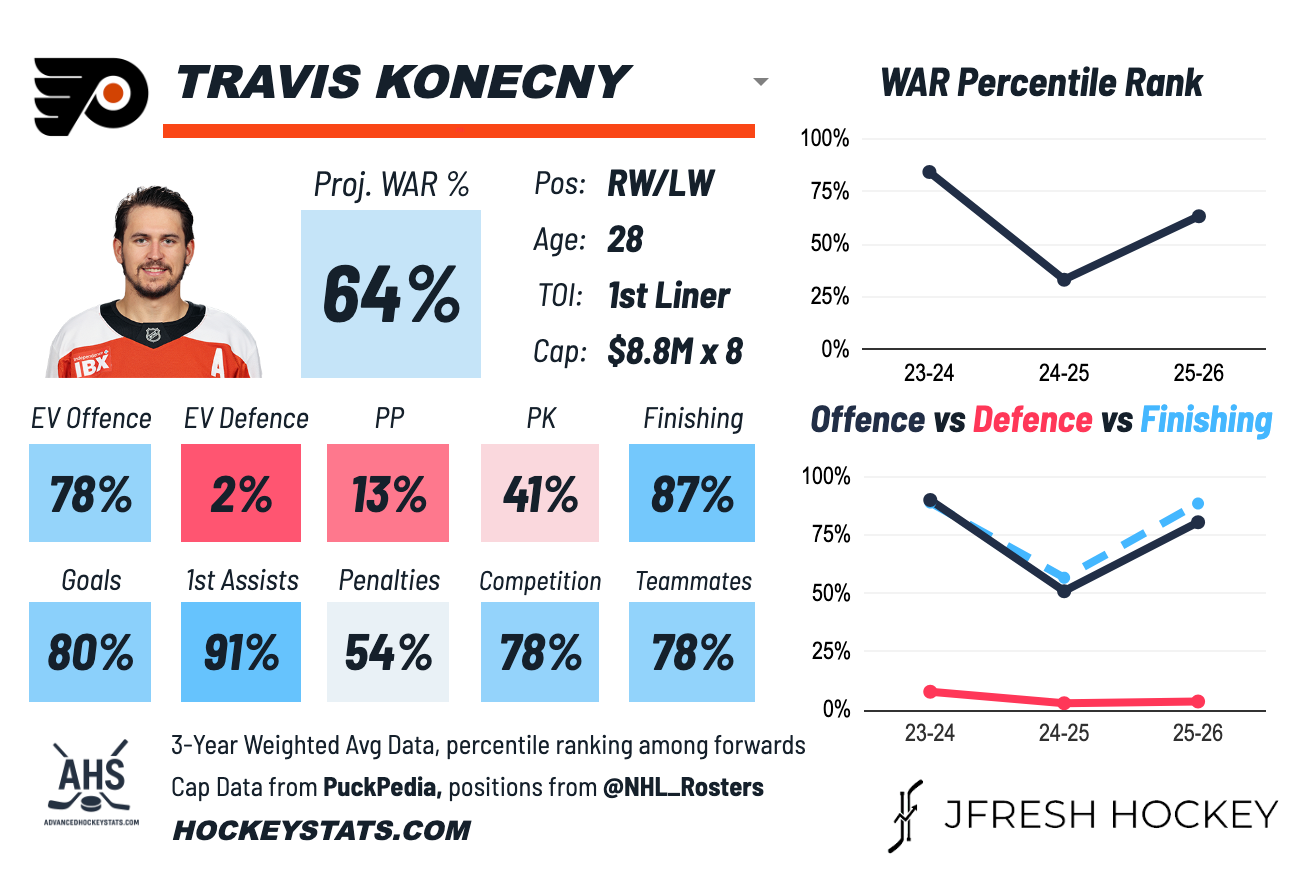
Our next model is a popular one that you may have seen on Reddit, Twitter, or Bluesky. Jfresh's very clean viz shows a lot of the same trends; really strong offensive, not so hot defense. It aligns with Evolving Hockey's GAR model quite nicely, so without repeating ourselves, we can move on.
HockeyStats also gives a glimpse into another very interesting topic: microstats.
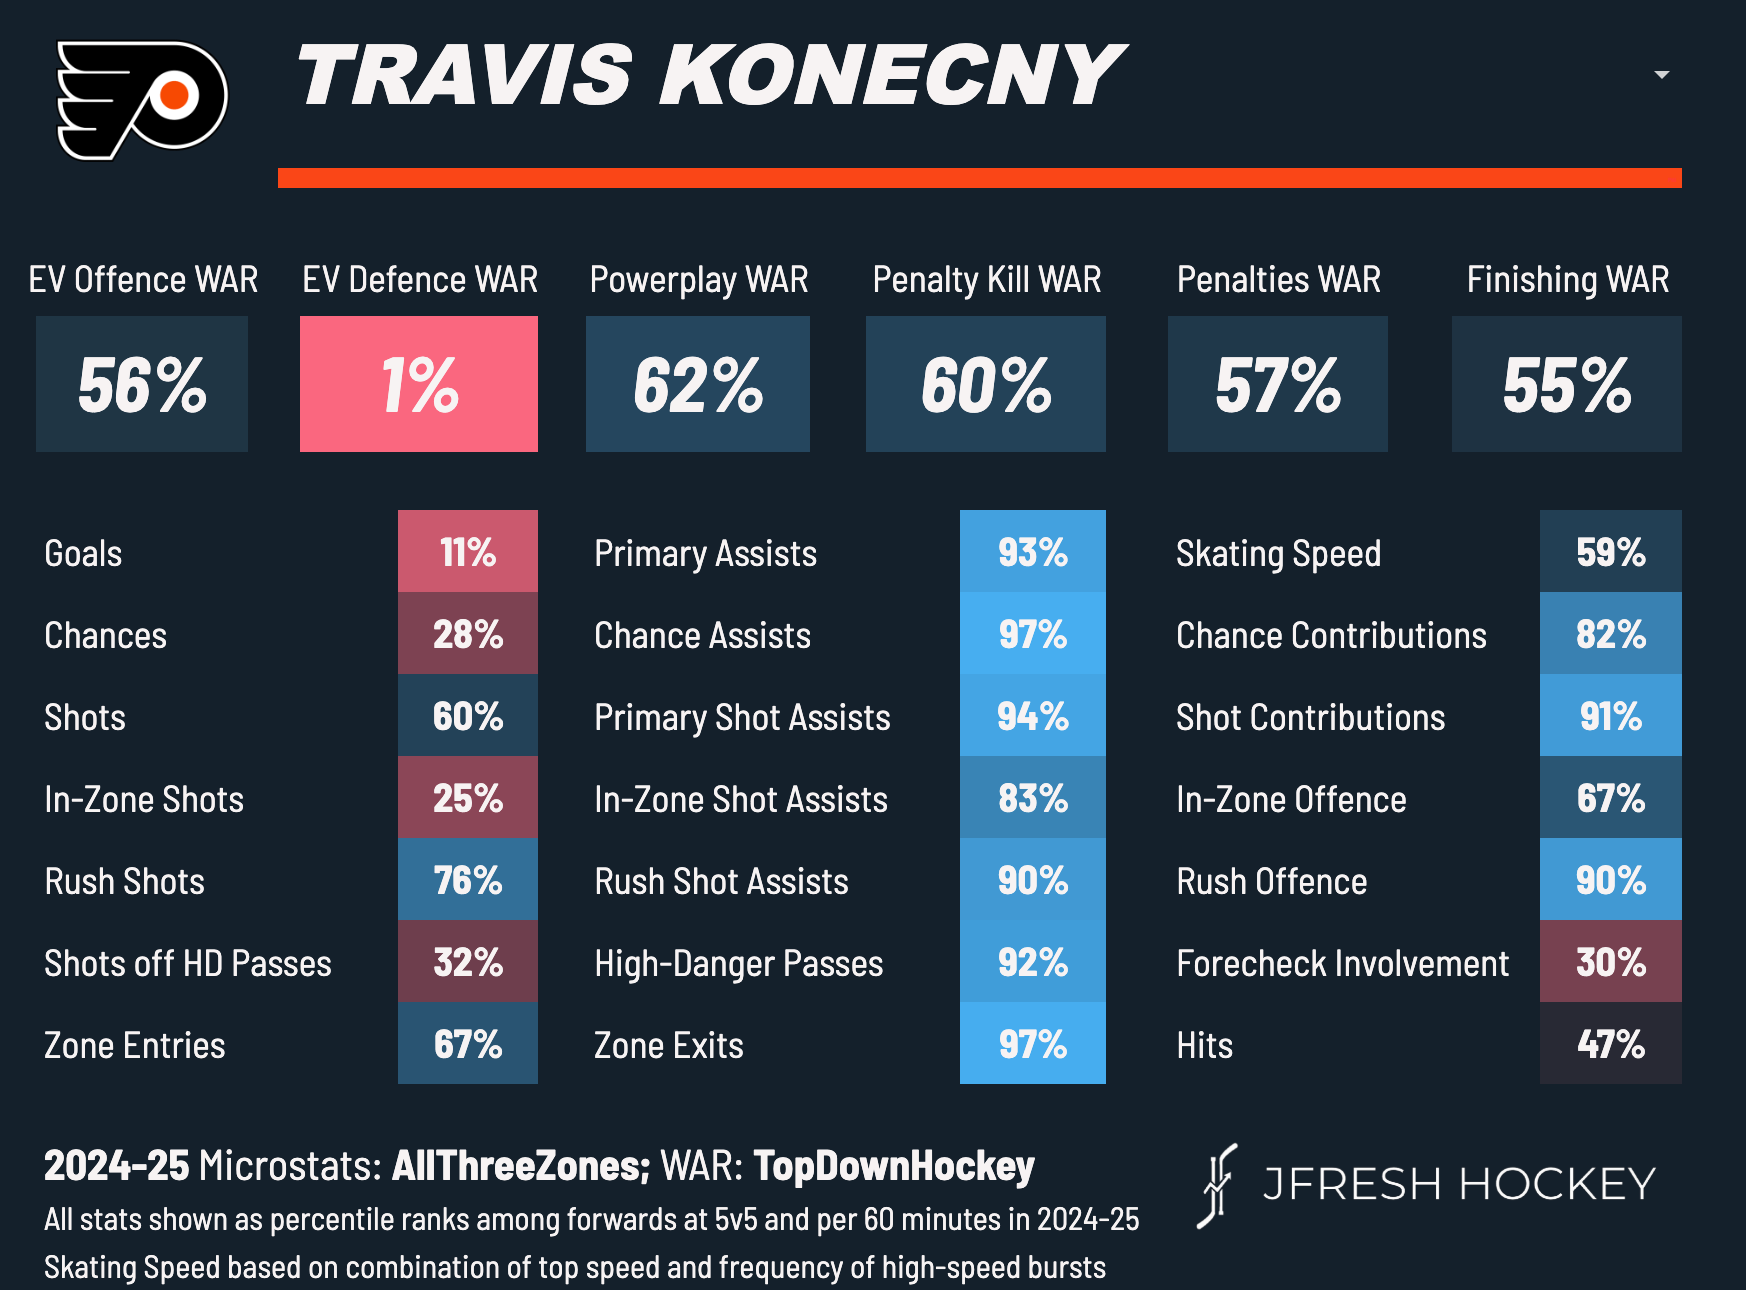
AllThreeZones.com is a great website that tracks the microdata that public models cannot get from the NHL's API. This allows us to see just exactly what is going on under the hood.
The stats above are from 2024-25, so last year, but they tell a really powerful story. Konecny is an amazing contributor for assists. He provides some of the most dangerous offenses in the league, which helps him produce the point totals he does.
Outside of his passing game, he's great at zone exists and a bit above average at zone entries. But the biggest weakness is how often he gets to shoot the puck, and his forecheck involvement. These are per 60-minute stats, meaning that Konecny needs big minutes in order to get his opportunities to score. That's an issue when you're evaluating how effective a player is in those minutes.
The other issue with AllThreeZone's data is that it is often a small piece of the The other issue with AllThreeZone's data is that it is often a small piece of the season that can be subject to sample size issues. Corey Sznajder is one man—an incredibly dedicated, perhaps insane one that the hockey community is incredibly grateful for—but one man nonetheless. We simply do not have all the data to look at a full season of Konecny's microstats, and that is something to consider as well.
HockeyViz
And finally, we have our final model: Micah Blake McCurdy of HockeyViz's Synthetic Goals (sG). And it is not very nice about Konecny's current play.
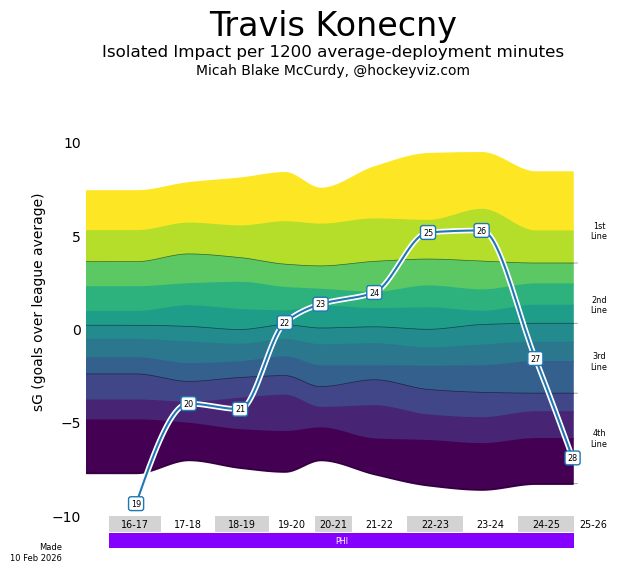
Before we get into the details of what the model is looking at, let's check out the timeline above. The numbers on the line are Konecny's age, and the Y-axis represents the amount of sG a player produces above average (so higher is better). As recently as 2023-24, Konecny graded out as a first-line quality forward after being a second-line quality forward for several years. Now? By sG, Konecny has fallen all the way down to a fourth-line quality player and has continued to fall all year. Let's look into why by checking out his player card.
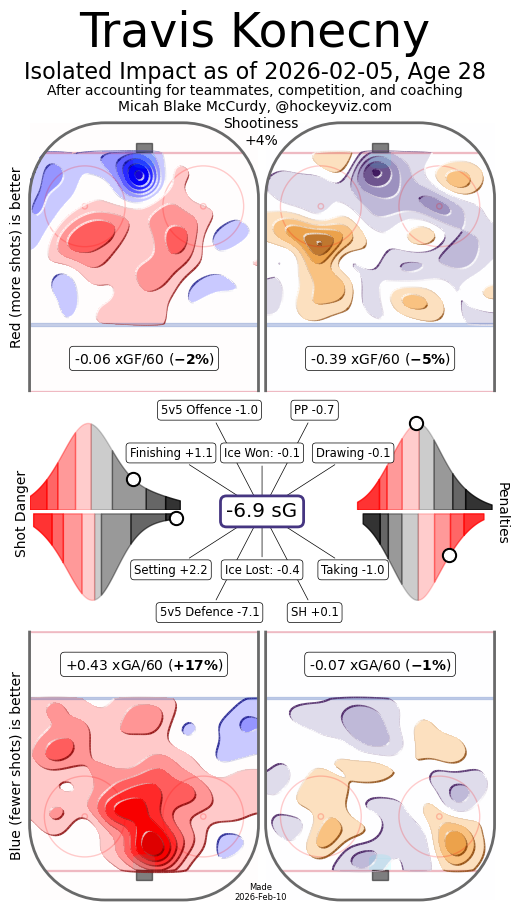
This chart has a lot going on, so let's break it down by what matters most here.
We're going to primarily be focusing on the left side here, which is from top to bottom: offensive shot quality (top ice heat map), finishing/goal scoring (the top histogram), passing (the bottom histogram), and defensive shot prevention (the bottom ice heat map).
Like most of the other models, by sG Konecny is an average offensive play driver (minus two percent lower than league average), an above-average goal scorer, one of the best passers in hockey , and possibly one of the worst defensive players in the sport (17 percent more expected goals against than average). sG puts a massive emphasis on play driving; being one of the best passers in the league is only worth +2.2 sG, while Konecny's even strength defense costs him -7.1 sG. His defense, combined with average offensive play, driving, and taking too many penalties, puts him at a minus 6.9. Let's take a look at possibly why.
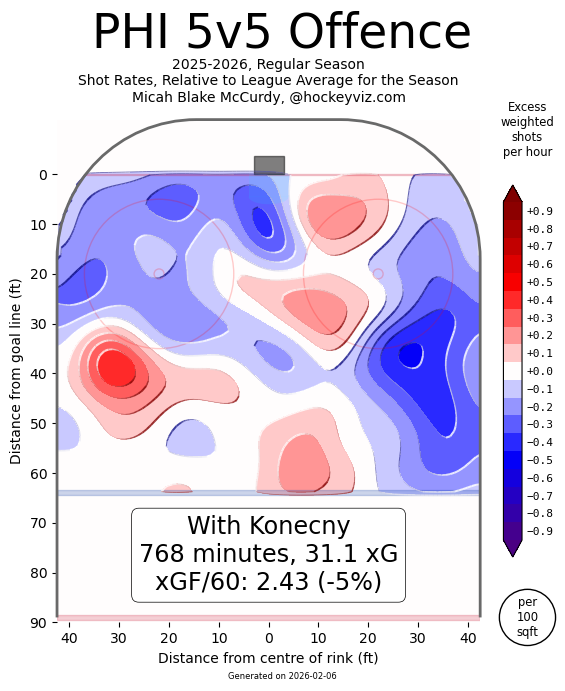
With Konecny on the ice, the Flyers produce five percent fewer expected goals per 60 than the league average.
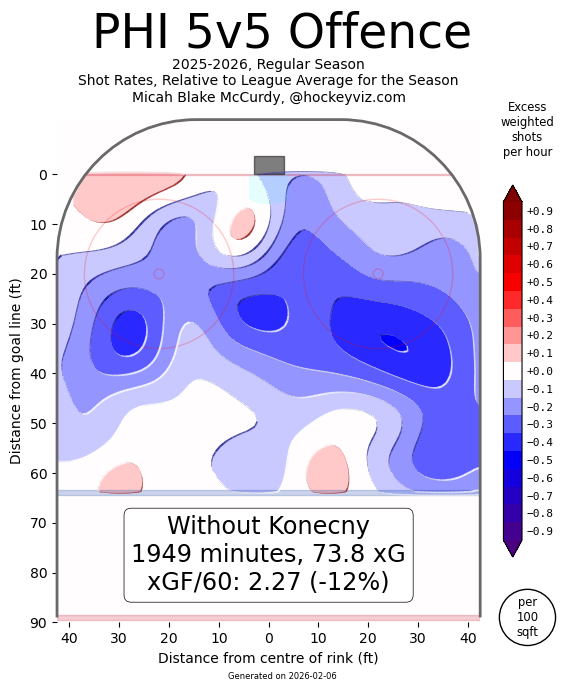
But without Konecny, the Flyers lose a lot of offensive momentum, dropping from minus five percent to minus 12 percent. Makes sense! The Flyers are generally pretty poor at offense, and Konecny is a boost, but not so much of a force that he drags them to being average. Now let's look defensively.
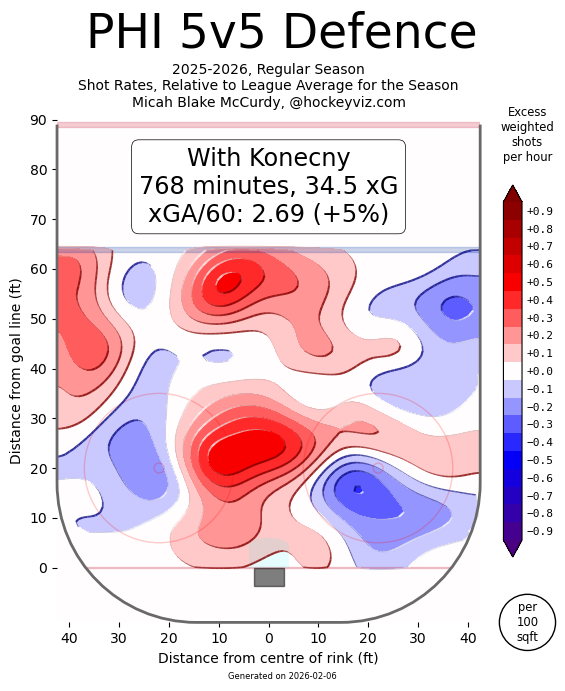
With Konecny on the ice, the Flyers give up five percent more expected goals than average. Not great, but where are we at as a baseline?
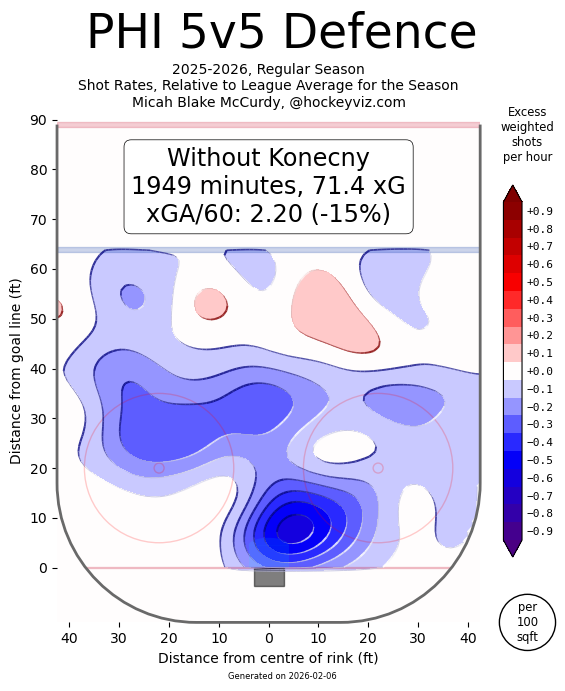
Oh. That's really not good.
That is a twenty-point swing against the Flyers when Konecny is on the ice, while it's only a positive seven percent gain offensively. Using the raw numbers given, the Flyers have a -0.26 expected goal differential with Konecny skating compared to +0.7 without him. That is a huge deal.
But hold on, isn't Konecny among the league leaders in points? How is that not factoring into this more? Like I said, sG factors expected goals into its model hard. It's still rating Sean Couturier as a first-line quality center, which, while many models still like Couturier's game, few would go that far. While this model does make some convincing arguments for underrated players in the league, it does tend to stand alone on other players.
So who's right? The players or the nerds?
We could spend an eternity debating a model and how it interprets a single player. The truth is that most of the time, both sides of the analysis have a point (boo cop-out boooo). Konecny represents a truly interesting player profile to analyze and understand.
Travis Konecny is one of the league's best "closers", a player uniquely suited to turning opportunities into dangerous plays. If you can get him into the offensive zone and setup with the puck, watch out. That is a very rare and valuable trait, which is what most players dream of having the skill to pull off against the world's best talent, which is why other players would value his play so much. What he is not is a play driver, a player who can drag an entire team to sustained success on the ice by producing chances for his team and limiting his opponents.
Konecny is more akin to a force multiplier—with a center or a winger that can utilize his high-end passing and cover his weaknesses defensively, and by moving the puck up the ice, he could potentially put up a bonkers amount of points and be a part of one of the most dangerous lines in hockey. Again, watch him work with Nathan MacKinnon in the IIHF World Championships. There were times they looked unstoppable.
And it makes sense; when Konecny was paired with peak Sean Couturier and Claude Giroux in the early stages of his career, they were one of the most complete and threatening lines in all of hockey. Imagine that line with a Konecny in his prime.
But at the same time, that does lower his value as a whole; he is more of a supporting piece (albeit an extremely good one) than a main driver of a team. It's why he tends to look his best this year when playing with Trevor Zegras, who is actually driving play very well. With a quality first-line center (or another more defensive wing with Zegras at center, like a Tyson Foerster), Konecny could be one of your best players on a cup team. His underlying numbers usually won't reflect that until that group is created.
So let's recap and wrap up.
Konecny's Model Rankings on the Flyers as of February 2026
- RAPM xG± — 21st
- GAR/xGAR — 8th
- Net Rating — 1st
- WAR — 6th
- sG — Low (Hockey Viz doesn't make it easy to count, and it seems like too much work to figure it out. You'll have to trust me.)
- The hearts and minds of the Philadelphia Flyers players — 1st
But we haven't asked Travis Konecny about what he might think about the matter. Let's ask.
Ya fuckin' nerd!
- Travis Konecny, to some other nerd, 2019 NHL Stadium Series
Ok, fair enough.